17.
CMMS functionality: Dynamic indicators and dashboards
Follow your statistical indicators and your activity with our AQ Manager Dashboard module!
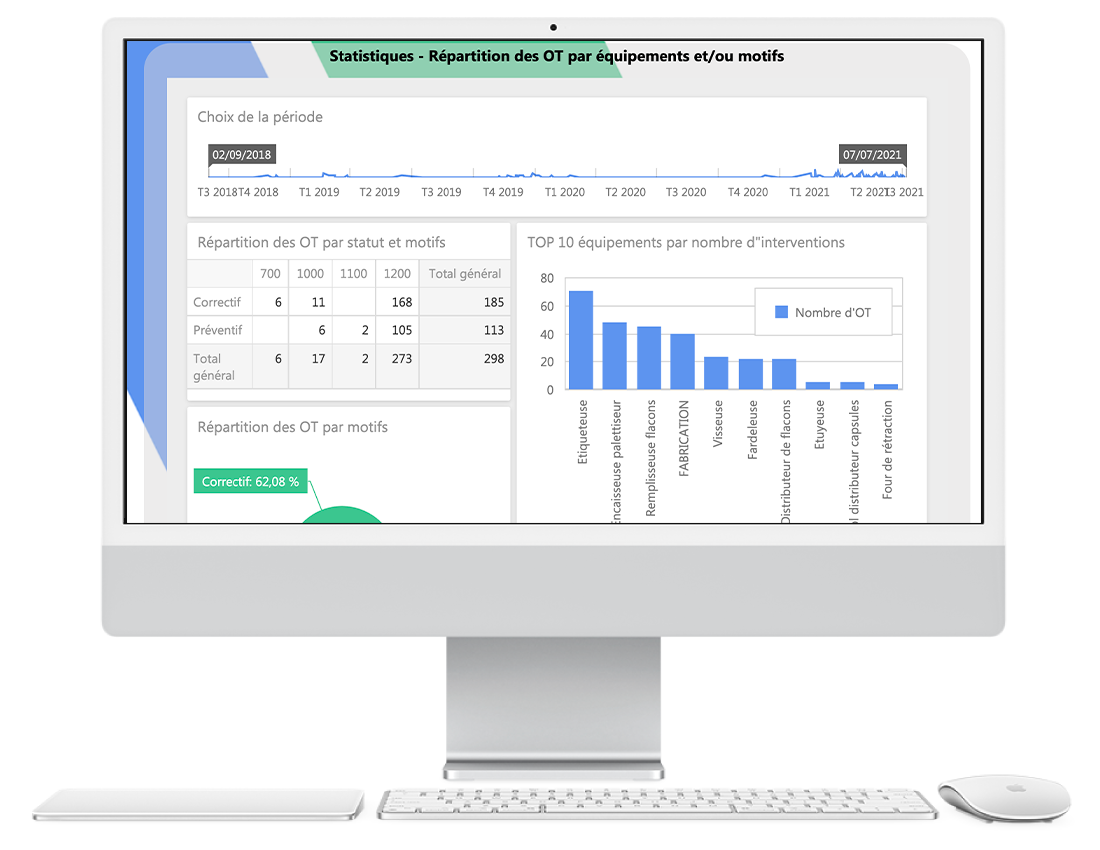
AQ Manager Dashboard is a dynamic dashboard generator integrated in our full web application. This functionality gives you the freedom to consult our pre-configured indicators. But also to easily create your own statistical library.
Our module allows you to create an unlimited number of dashboards grouping your indicators, statistics and custom KPIs. You can assemble graphical indicators, pivot tables, data lists, etc. on each page.
In addition, our tables include a dynamic detailed consultation of statistical data. This allows you to consult more precise information by simply clicking on an area of an indicator.
For example: click on a branch of a histogram and display another one with a detailed view
Our AQ Manager Dashboard module can also connect to external data sources such as your ERP, BMS, BMS, etc.
Discover the features of our module in the video opposite.
Our tool is open to other databases, so you can create dashboards on data outside our AQ Manager CMMS Full Web application.

Thanks to our advanced rights management, you can also define which users within your company can view, modify or delete each of your dynamic dashboards.
As our AQ Manager solution is a 100% web-based application, you can easily share your dashboards with others through a simple web browser.
You can even subscribe to receive these dashboards or send them to other users automatically by e-mail at regular intervals (e.g. the 1st of each month)!
Do you have any questions about our CMMS? Contact us!
Our teams will be happy to discuss your needs and projects with you.


